Home › Forums › Labs & technology › Comparative SEM measurements and 3D roughness reconstruction of two different implant samples
Welcome Dear Guest
To create a new topic please register on the forums. For help contact : discussdentistry@hotmail.com
- This topic has 0 replies, 1 voice, and was last updated 31/07/2016 at 1:03 pm by
 Dr Jayesh.
-
AuthorPosts
-
31/07/2016 at 1:03 pm #13210
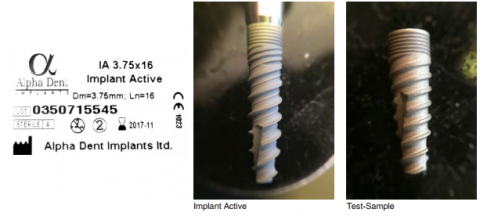
Implant Alpha Dent Active with 3D Active surface vs test-sample with RBM surface
The scientific workstation is a Phenom proX Scanning Electron Microscope, equipped with a high-sensitivity backscattered electron detector that allows compo- sitional and topographical imaging modes. EDX analyses are performed with a thermoelectrically cooled Silicon Drift Detector (SDD.) Without touching the surface, each implant will be taken out of the package with sterile forceps and will be fixed on the sample holders. After the vacuum is generated in the electron microscope imaging and EDXanalyses will be completed.
With a specific 3D roughness reconstruction application, based on a „shape from shading” technology, the SEM system used in this study is able to generate three- dimensional images and submicrometer roughness measurements. 3D imaging helps to interpret sample characteristics and makes images under- standable. In addition the system is able to measure the average roughness (Ra) and the roughness height (Rz). Due to shape-from-shading technology Ra and Rz data in this study are to be generally understood merely as approximate values.
The coloured “heatmap” in this report shows the digitally flattened larger structure of every region of interest (ROI) like
the concave valley of a thread or the convex structure of the outer ridge of the thread. The highest point in this texture is red (“hot”) and the deepest point is blue (cold). Three parallel lines along this structure perpendicular to the implant axis follow the 3-dimensional structure. The average Ra of these three lines allows to compare with the average Ra on the same ROI’s on other implants like the comparison object in this analysis.Scanning electron microscopy (SEM) enables the topical evaluation of the implant surface. In particular at low voltages and small working distances, images with high contrast can be obtained. The high-sensitivity backscattered electron detector is generating images in compositional and topographical modes to a magnification of 20.000x. Besides information about morphology and surface topography, the BSE detector allows to draw conclusions about the chemical nature and allocation of different remnants or
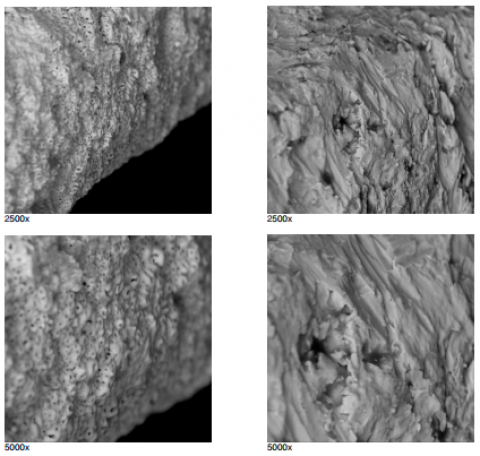
SEM-COMPARISON OF IMPLANT ACTIVE WITH 3D ACTIVE SURFACE vs. TEST-SAMPLE WITH RBM SURFACE
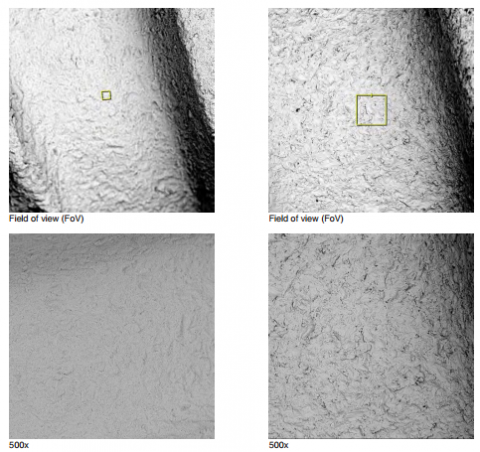
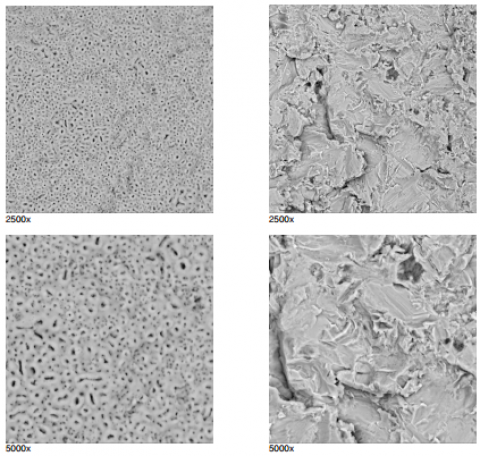
SEM-Comparison of Implant body with 3d active surface vs implant with RBM surface
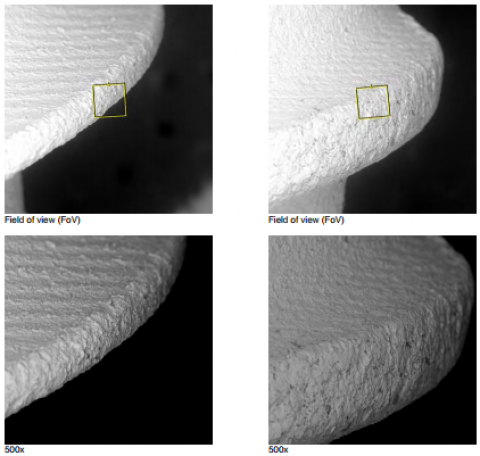
SEM-Comparison of implant thread with 3D Active surface vs implant with RBM surface
3D ROUGHNESS RECONSTRUCTION OF IMPLANT ACTIVE WITH 3D ACTIVE SURFACE
3D Roughness Reconstruction of Implant-Body (Peak)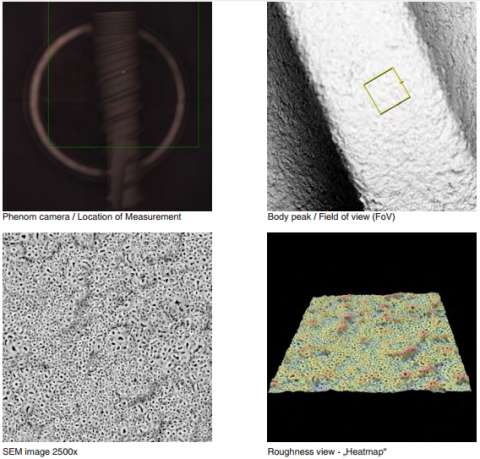
3D ROUGHNESS RECONSTRUCTION – TEST-SAMPLE OF IMPLANT BODY WITH RBM SURFACE
3D Roughness Reconstruction of Implant-Body (Peak)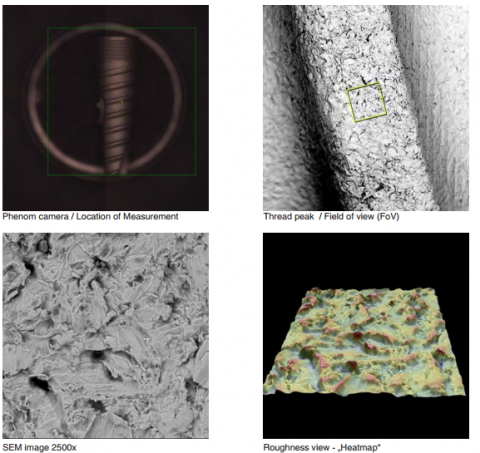
Conclusions:
In comparison to the “Test-Sample” with RBM surface the “Implant Active” with 3D Active surface has a higher roughness in the area of the microthreads (in the valleys and peaks of the threads) and a higher roughness in the area of the implant body. -
AuthorPosts
- You must be logged in to reply to this topic.